My Original Research Contributions
This page documents my original contributions to 3DGS-based plant phenotyping.
1. Scale-Invariant Height Extraction
The Problem
Traditional PLY-based height measurement suffers from temporal scale inconsistency.
 Figure 1: Scale inconsistency in PLY-based measurement across dates (CV: 28.0%)
Challenge Identified
Structure-from-Motion (SfM) reconstruction produces different coordinate scales for each capture date, making direct height comparison unreliable.
My Solution
Innovation: Rendered image-based trait extraction in normalized image space, used for relative growth monitoring rather than absolute measurement.
graph TD
    A[3DGS Model] --> B[Render Top View]
    B --> C[Normalize by Image Dimensions]
    C --> D[Extract Height in Pixels]
    D --> E[Scale-Invariant Measurement]

    style E fill:#90EE90
Implementation Video
Video 1: Demonstration of scale-invariant height extraction method
Results Comparison
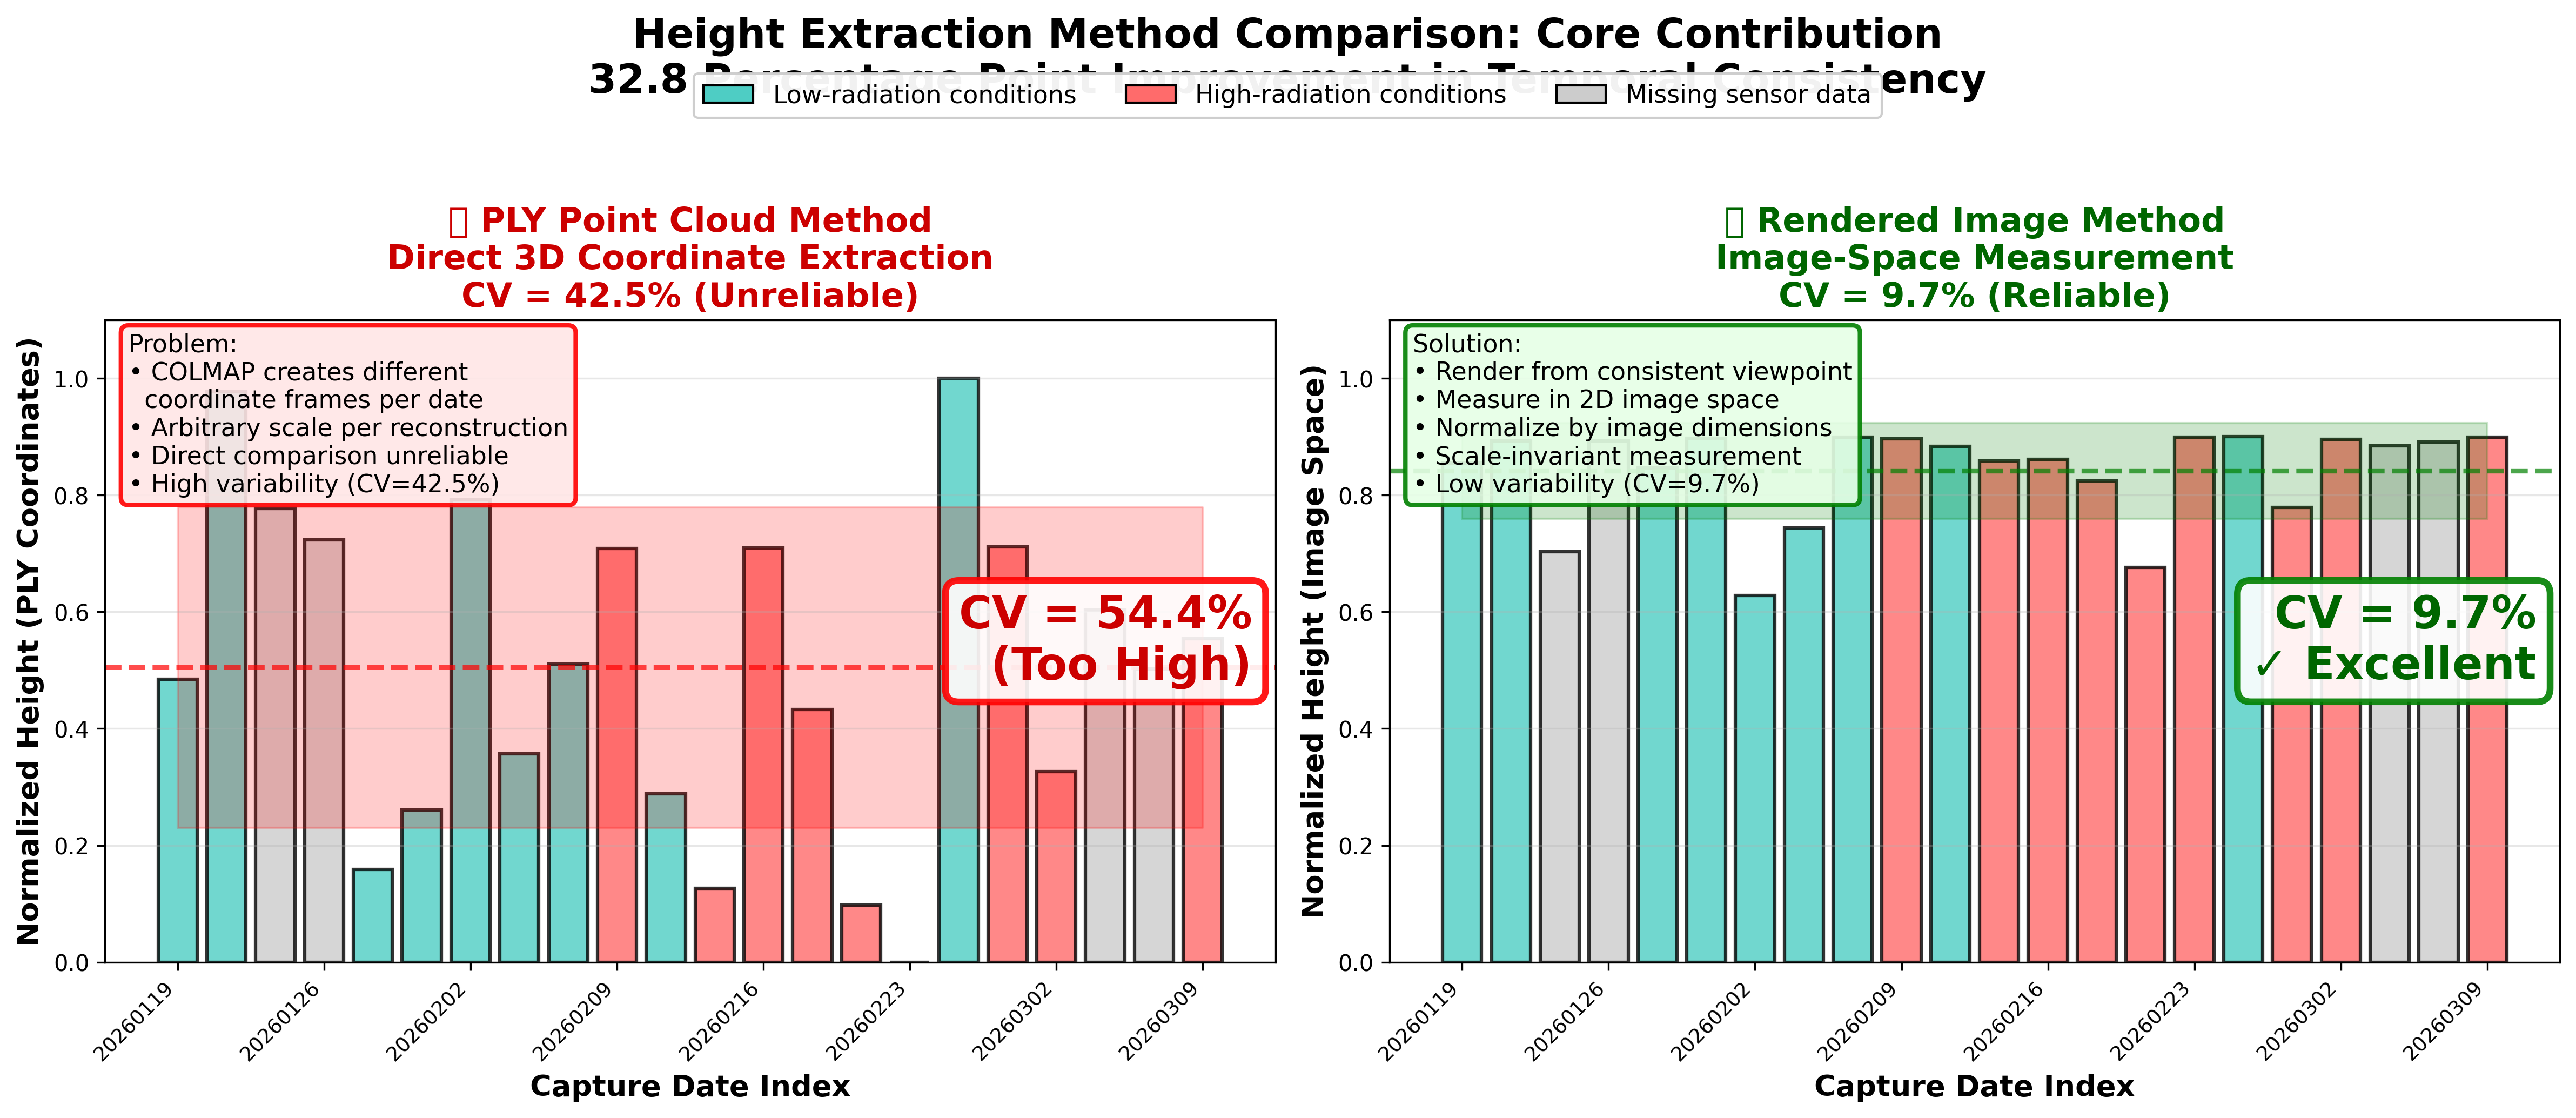 Figure 2: My method achieves 18.2 percentage point (2.86×) improvement (CV: 28.0% → 9.8%)
Original Contribution #1
First demonstration of scale-invariant trait extraction from multi-date 3DGS reconstructions for plant phenotyping.
- Method: Image-space normalization
- Result: 18.2pp CV improvement (2.86×)
- Validation: 22 dates, 49 days
- Impact: Enables reliable time-series growth monitoring (relative change, not absolute trait values)
Calibration is the wrong fix
Applying a per-session scale factor to the direct-3D height makes it worse, not better (CV 35.1% vs 28.0%): the estimated scale factor is itself noisy and injects its own variance. This is what motivates measuring in the render, where the scale cancels by construction.
Biological Validation — Pruning-Event Detection
The strongest evidence that the render-space signal tracks real biology (not just numerical stability) is that it detects documented crop-management events.
 Render-space height over 49 days: smooth regrowth punctuated by three sharp drops, each aligned with a documented pruning event.
Biological validation
Three documented pruning events are each detected as a sharp drop in render-space height (mean drop ≈ 0.20 in normalized height, 15–27 percentage points — well above the 9.8% background variation).
- Significance: p = 0.0008 (drops at pruning dates vs. non-pruning dates)
- Meaning: the pipeline responds to real management events, so it is a usable monitoring / change-detection signal.
Physical-Reference Corroboration — 45 cm Pipe
To ground the render-space height against something physical, an in-scene bench pipe of known length (45 cm) is used as a ruler that is co-visible with the plant.
Reference height: h_gt = (plant_px / pipe_px) × 45 cm, annotated in all 22 sessions.
Physical-reference agreement
Render-space height correlates with the pipe-ratio reference across all 22 sessions:
- Pearson r = 0.74 (p < 0.001), R² = 0.55
- Reference mean height 159.9 cm; comparable spread (h_gt CV 8.9% vs. h_norm CV 9.6%)
- The pipe spans 263–420 px for a fixed 45 cm, so the ~45% unexplained variance is noise in the reference instrument (SfM scale ambiguity), not pipeline error.
Honest scope
This is corroboration that the signal is grounded in reality — not proof of absolute accuracy. No calibrated tape-measure ground truth (RMSE) was collected for these sessions; see Results & Validation for the limitation and the planned ground-truth protocol.
2. Environmental Correlation Analysis
Sensor Deployment
 Photo 1: Multi-modal sensor deployment in greenhouse environment
Data Collection
I integrated IoT sensors measuring: - Temperature (°C) - Humidity (%) - Solar radiation (W/m²)
Discovery: Humidity Correlation
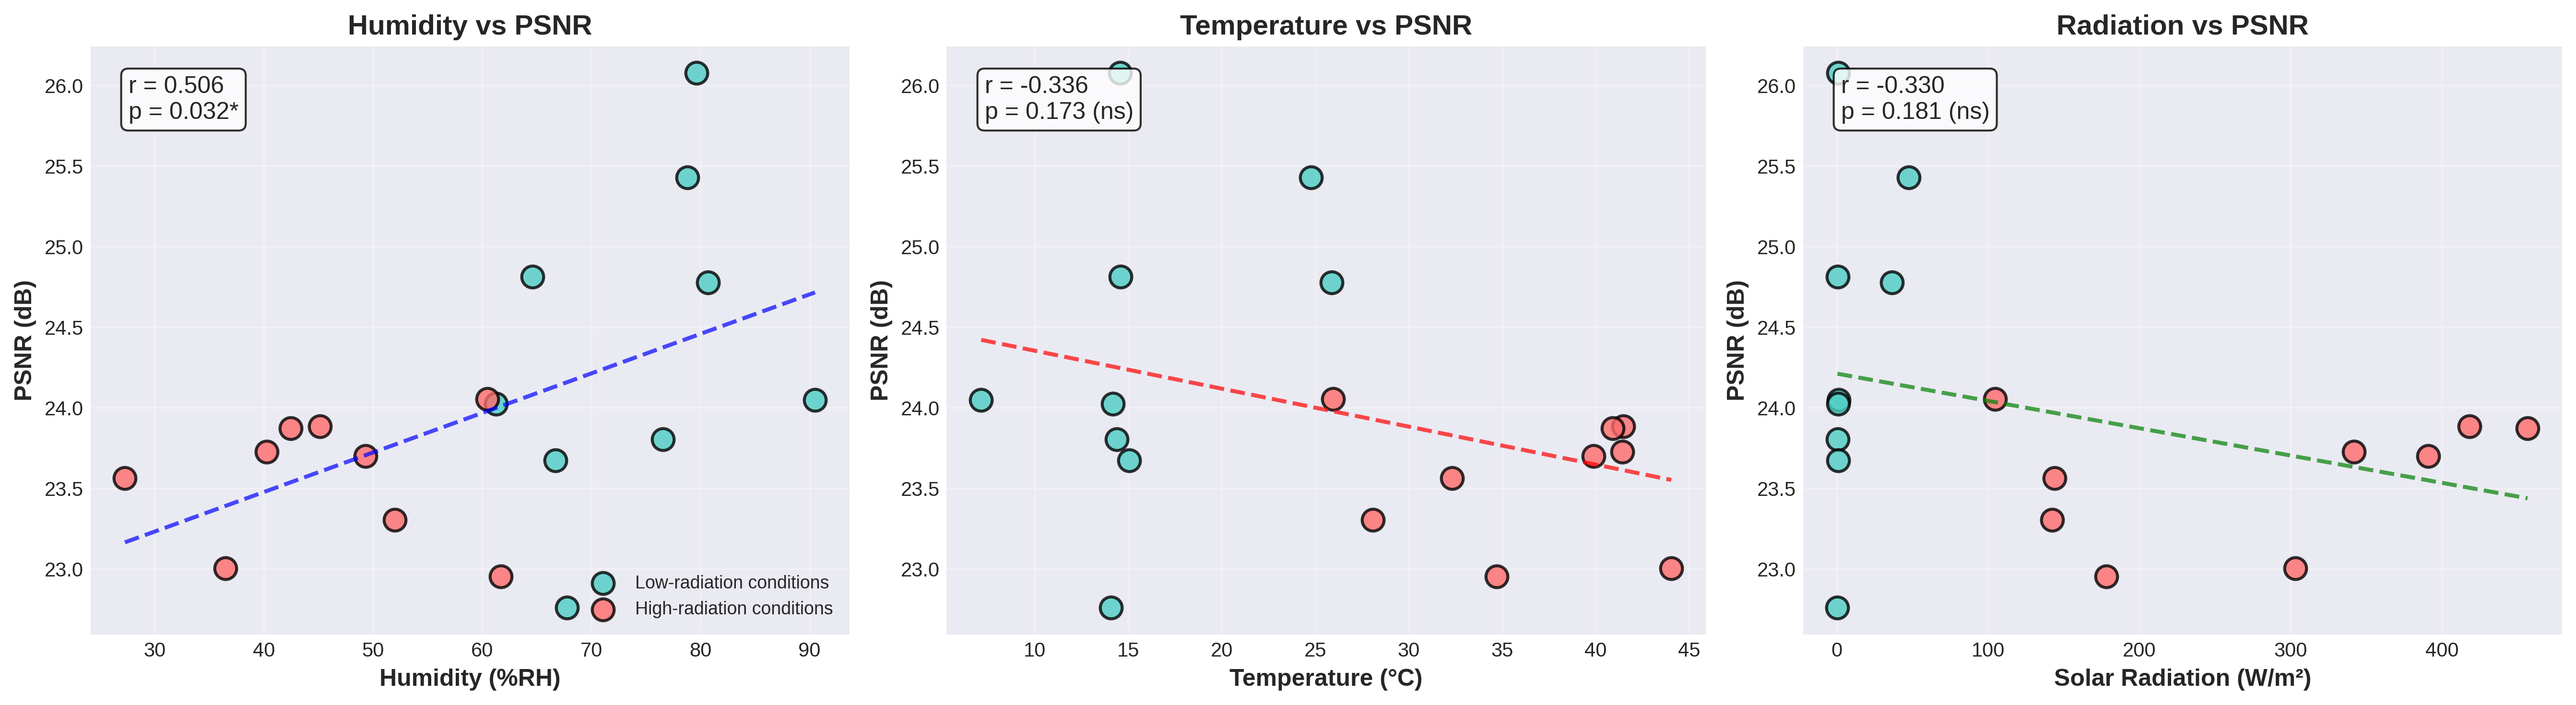 Figure 3: Environmental factors vs 3DGS reconstruction quality (n=18)
Original Discovery
Significant humidity correlation with PSNR:
- Correlation coefficient: r = +0.506
- P-value: p = 0.032 (significant at α=0.05)
- Interpretation: Higher humidity → better reconstruction quality
First identification of environmental effects on 3DGS quality
Radiation-Based Classification
 Figure 4: Data-driven 100 W/m² threshold with WMO validation
My Method: 1. Data-driven: Natural gap at 57.6 W/m² (47.1 → 104.7) 2. WMO standard: 100 W/m² meteorological threshold 3. Statistical: Perfect balance (n=9 vs n=9)
Original Contribution #2
First radiation-based classification for 3DGS reconstruction quality in controlled environments.
3. Complete 50-Day Validation
Time-Series Dataset
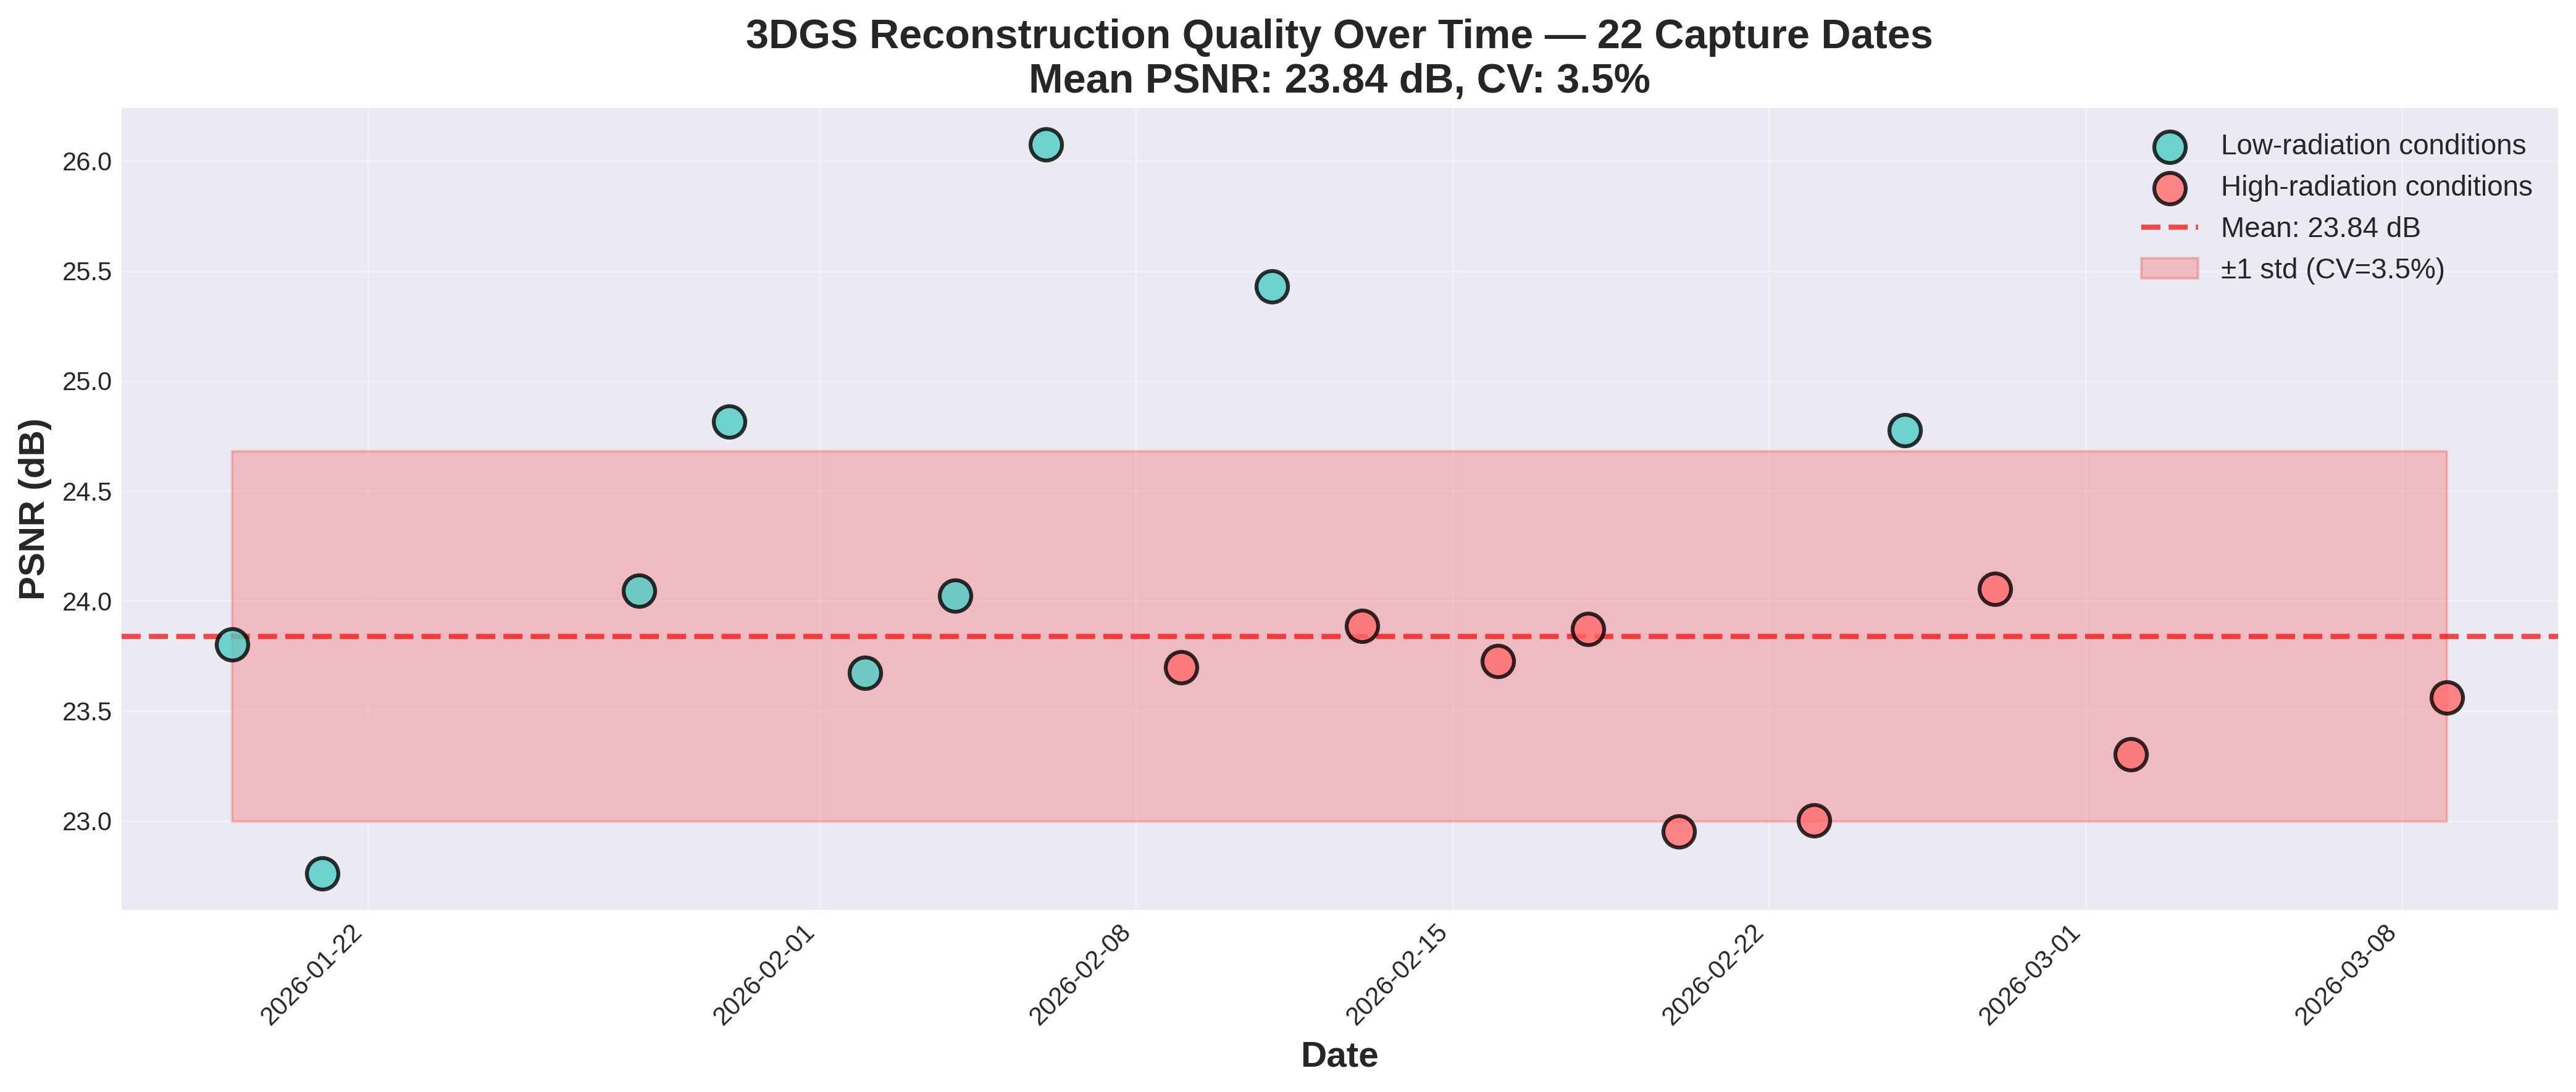 Figure 5: Temporal stability across 22 dates (PSNR: 23.84 ± 0.83 dB, CV: 3.5%)
Growth Monitoring Results
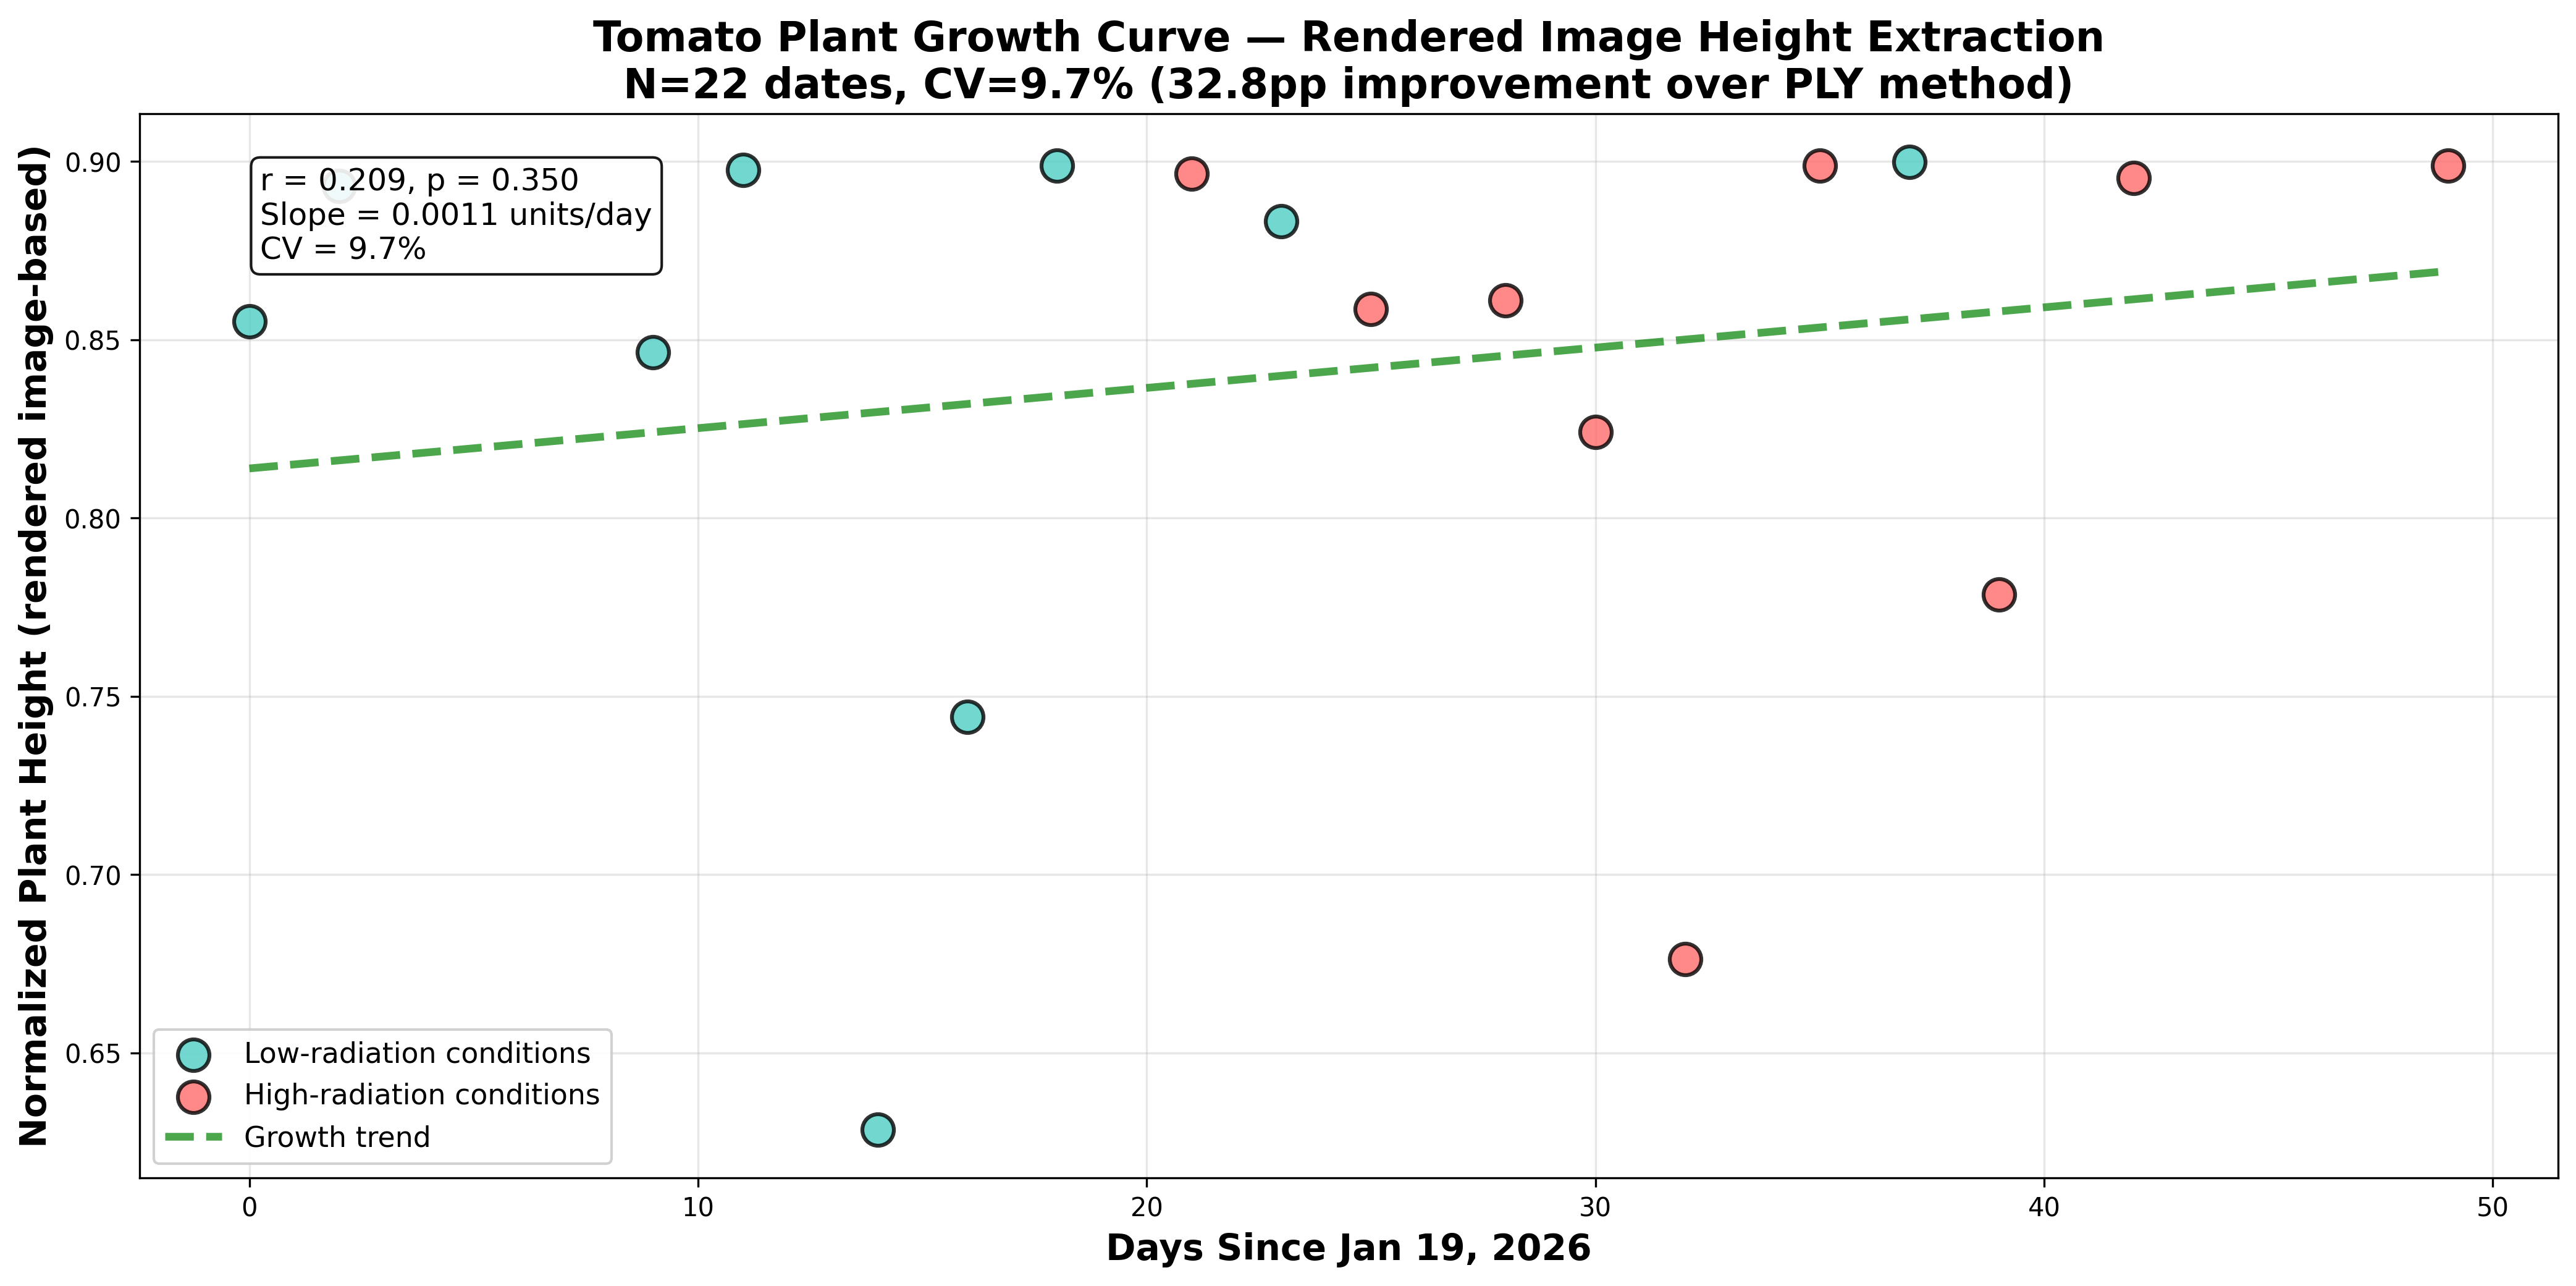
Figure 6: 49-day continuous monitoring with my pipeline
Time-lapse Video
Video 2: 49 days of tomato growth captured with my 3DGS pipeline (Jan 19 - Mar 9, 2026)
Original Contribution #3
First long-term validation of 3DGS for time-series plant phenotyping.
- Duration: 49 days
- Frequency: 22 capture dates
- Consistency: CV = 3.5% (PSNR)
- Growth tracking: Positive correlation (r = 0.209)
4. Complete Pipeline Integration
System Architecture
 Figure 7: Complete system architecture integrating 3DGS with IoT sensors
Execution Demonstration
Video 3: Complete pipeline execution (small video hosted directly)
📊 Summary of Contributions
| Contribution | Innovation | Impact | Validation |
|---|---|---|---|
| Scale-invariant render-space monitoring | Image-space normalization | 18.2pp CV improvement (2.86×) | 22 dates, 49 days |
| Pruning-event detection | Change detection from render-space traits | Biological validation | 3 events, p = 0.0008 |
| Physical-reference corroboration | In-scene 45 cm pipe ratio | Grounded in real-world scale | r = 0.74, p < 0.001 |
| Environmental Correlation | Humidity-PSNR relationship | First identification | r=+0.506*, p=0.032 |
| Radiation Classification | Data-driven 100 W/m² threshold | WMO-validated method | Perfect balance n=9:9 |
| Long-term Validation | 49-day continuous monitoring | Temporal consistency | CV = 3.5% |
📄 Publications
My research is documented in:
✅ Progress Report 4 (April 2026)
Complete methodology and validation results
📝 Master's Thesis (September 2026)
In progress
Target submission: September 2026
📄 Computers and Electronics in Agriculture (Elsevier)
Under review
Scale-invariant 3DGS for time-series greenhouse plant monitoring
🎓 Presentations
- ✅ ISFAR-SU 2026 (Completed) - Domestic conference presentation
- 🎯 International Conference (Planned) - Target: Late 2026
All figures, videos, and results shown on this page are original work conducted by Zobaer Al at Mineno Laboratory, Shizuoka University.